Menu

Slides

Find a page by what it says or how it’s put together.
Filter (1)

45 slides

Slide results

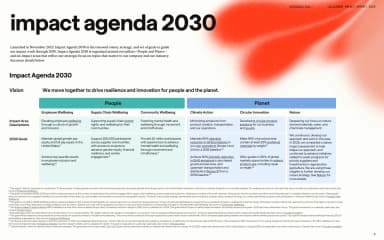
A six-column strategy table uses colour bands to distinguish people and planet priorities beneath a large black heading.
Impact Agenda 2030 · lululemon · Page 6
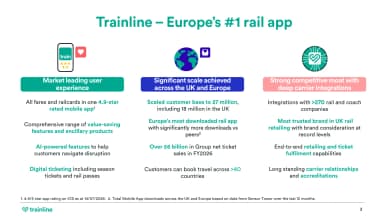
Three teal-topped columns explain user experience, scale and carrier integrations with aligned supporting bullets.
Trainline in the UK and Europe · Trainline · Page 4
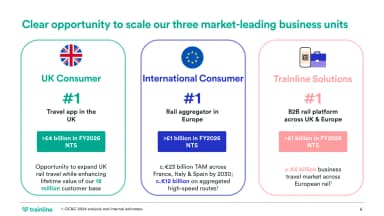
Three numbered business-unit columns align market positions and addressable opportunities with coloured headers.
Opportunity to scale · Trainline · Page 6
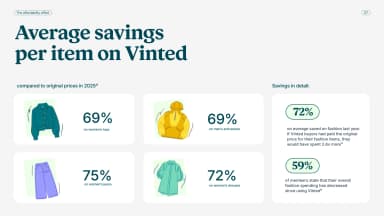
Four pastel product tiles compare percentage savings for different garments beside a vertical summary panel.
Average savings per item · Vinted · Page 8
A wide pale cover places a solid red rectangle beside a small report title and an oversized black 2025.
Sustainability Report 2025 · Polestar · Page 1
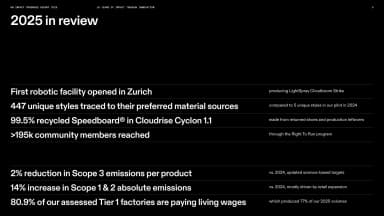
White figures and concise statements form an aligned review table across a black landscape page, with fine horizontal separators.
2025 in review · On · Page 5
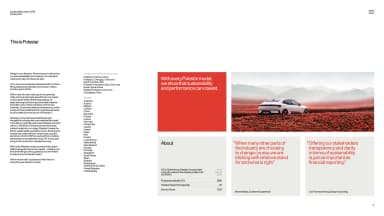
Small editorial columns and a market list share a white landscape page with red quotations, a car photograph and compact company facts.
This is Polestar · Polestar · Page 5
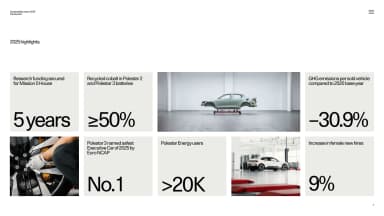
A modular grid mixes large black metrics on pale tiles with product and workshop photographs, surrounded by white space.
2025 highlights · Polestar · Page 7
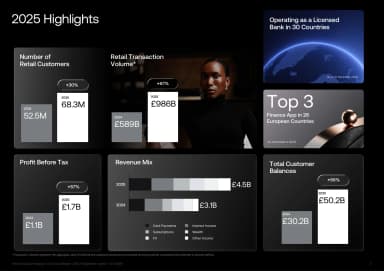
A dark modular dashboard combines bars, product photography and figures for customers, balances and revenue.
2025 retail highlights · Revolut · Page 4
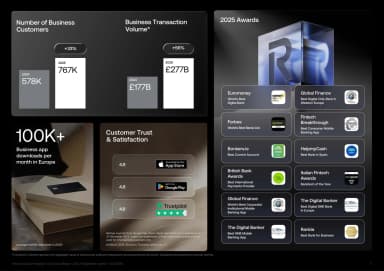
Aligned panels group business-customer metrics, transaction figures, ratings and awards against black.
2025 business highlights · Revolut · Page 5
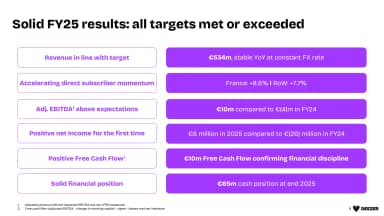
A two-column results table aligns financial priorities with purple metric bars and short supporting figures.
Solid FY25 results · Deezer · Page 4
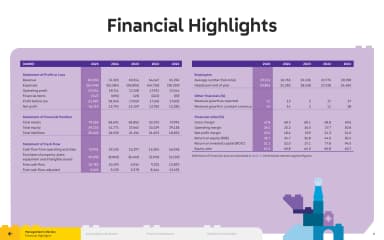
A purple financial table aligns annual numbers in a crisp, colour-coded grid.
Financial highlights · The LEGO Group · Page 6
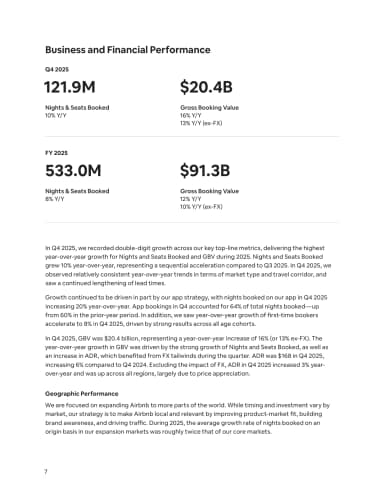
Two pairs of large financial figures, divided by thin rules, introduce a portrait page of business and geographic commentary.
Business and Financial Performance · Airbnb · Page 7
Train and bus photographs sit beside an orange-and-navy graphic motif and Transport for London’s 2026 Business Plan title on a cream cover.
2026 Business Plan · Transport for London · Page 1
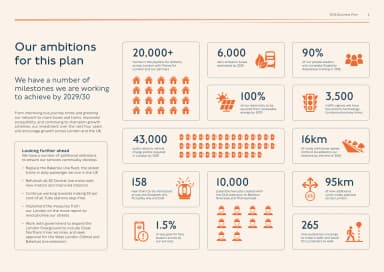
Orange pictograms and large figures form a dashboard of TfL’s planned milestones, with longer-term ambitions in a text column at the left.
Our ambitions for this plan · Transport for London · Page 6
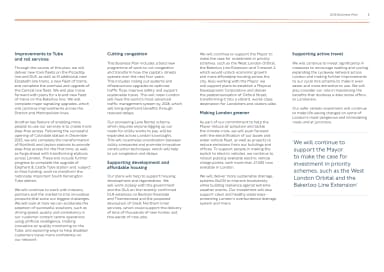
Four text columns set out rail, congestion, housing, environmental and active-travel plans beneath a fine orange rule, with a pull quote at the right.
Improvements across services · Transport for London · Page 8
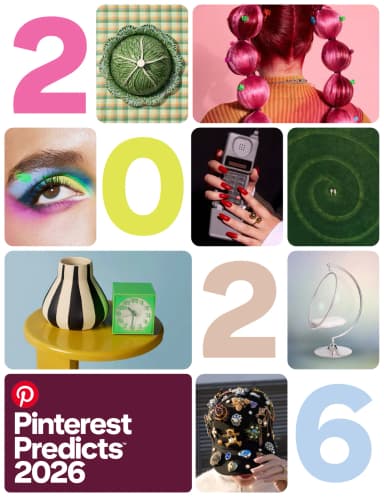
Pinterest Predicts 2026 uses rounded image tiles and pastel year numerals to combine fashion, food, interiors and beauty on a portrait cover.
Pinterest Predicts 2026 · Pinterest · Page 1
An orange-lit car silhouette sits beneath Volvo Cars’ Strategy update title and 6 November 2025 date, framed by fine rectangular rules.
Strategy update · Volvo Cars · Page 1
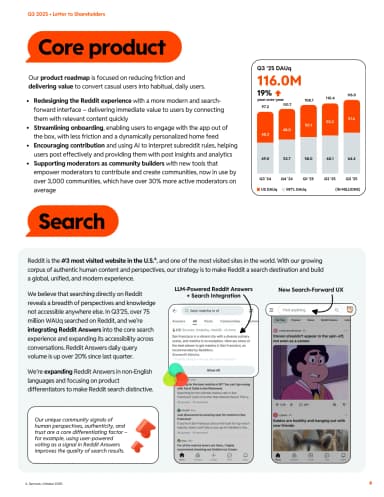
Orange label shapes organise product narrative, a user-growth chart and mobile search interface examples.
Core product and search · Reddit · Page 6
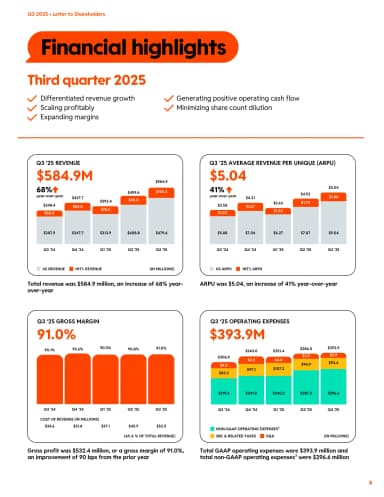
Four chart panels compare Reddit’s revenue, revenue per user, gross margin and operating expenses using orange, yellow and blue accents.
Financial highlights · Reddit · Page 8
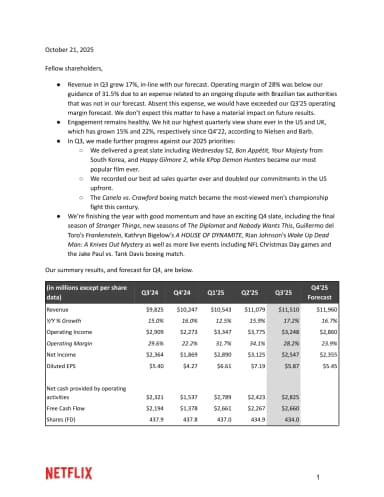
Netflix’s letter dated 21 October 2025 opens with bullet-point business highlights and a compact financial table above the red wordmark.
Q3 2025 shareholder letter · Netflix · Page 1
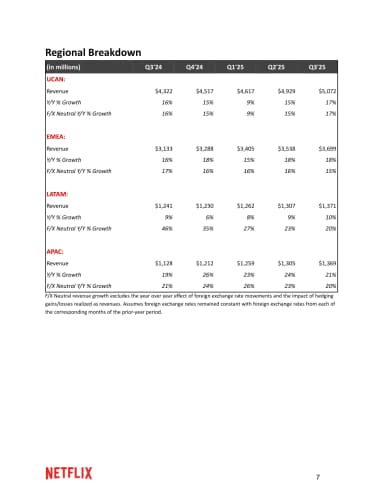
A compact table compares regional revenue and growth across quarters with red group labels.
Regional breakdown · Netflix · Page 7
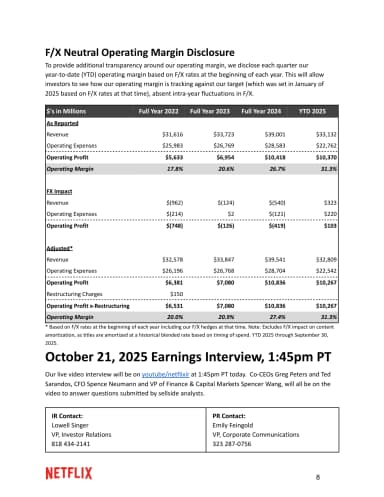
A grey table compares foreign-exchange-neutral operating margins above earnings-interview details and two investor contact blocks.
FX-neutral operating margin disclosure · Netflix · Page 8
A playful guide uses labels, links and colour to explain how to use the report.
Navigating this document · Channel 4 · Page 7
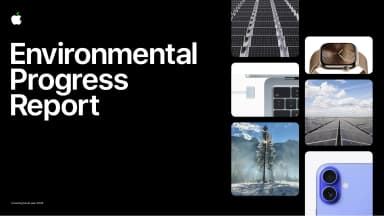
Apple’s Environmental Progress Report cover pairs a black title field with a mosaic of products, materials and environmental imagery, labelled as covering fiscal 2024.
Environmental Progress Report 2025 · Apple · Page 1
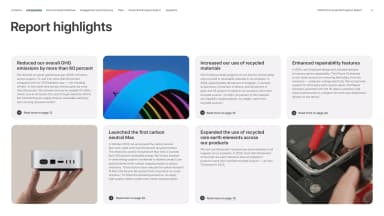
Five pale highlight cards about emissions, materials, a Mac and repairability alternate with three photographs in a two-row grid.
Report highlights · Apple · Page 4
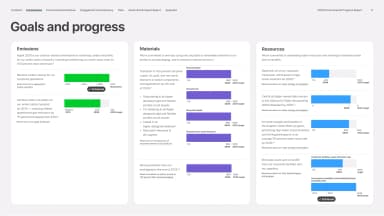
A three-column dashboard aligns Apple’s carbon, resource and chemistry goals with green, purple and blue progress bars and explanatory labels.
Goals and progress · Apple · Page 5
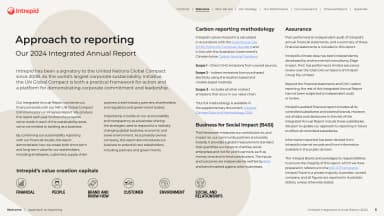
A disciplined grid groups reporting principles, methodology and small framework marks on a pale page.
Approach to reporting · Intrepid Travel · Page 6
A dense montage brings performers and recording artists together in a grid of rounded photographic tiles.
Artists across generations · Universal Music Group · Page 5
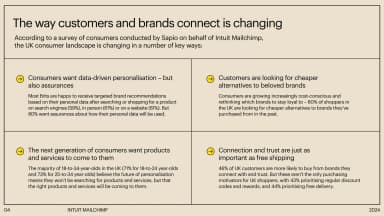
A cream two-by-two panel summarises Mailchimp’s survey themes of consumer trust, connection and preferences, separated by fine rules and yellow markers.
How customers and brands connect · Intuit Mailchimp · Page 4
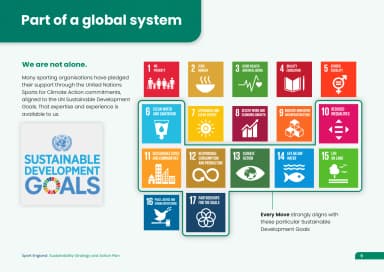
Sustainable Development Goal tiles sit beside a short account of the plan's global context and a small callout.
Part of a global system · Sport England · Page 9
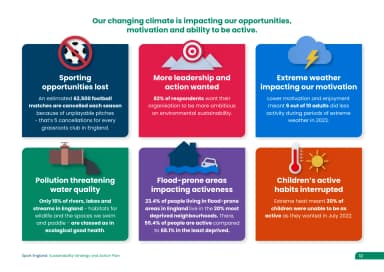
Six colourful illustrated cards explain disruption from extreme weather, pollution and changing environments.
Climate impacts on sport · Sport England · Page 12
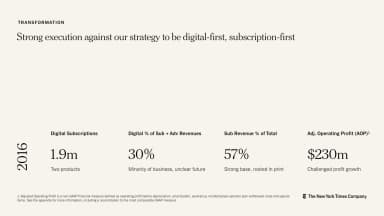
A light transformation page aligns four business metrics along a shared baseline for 2016.
Digital-first, subscription-first · The New York Times Company · Page 9
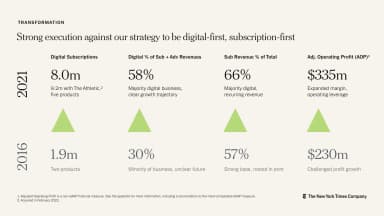
A matching metrics page compares 2016 and 2021 figures, using green triangles to emphasise growth.
Transformation in 2021 · The New York Times Company · Page 10
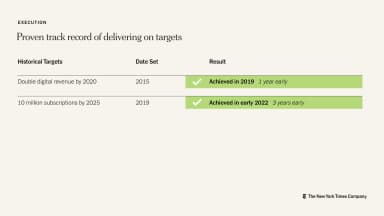
A three-column table records historic targets, the year set and results highlighted in green.
Delivering on targets · The New York Times Company · Page 11
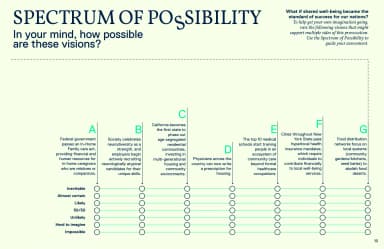
A full-page matrix combines several futures with rows of indicators and a legend.
Spectrum of possibility · Omidyar Network & Guild of Future Architects · Page 10
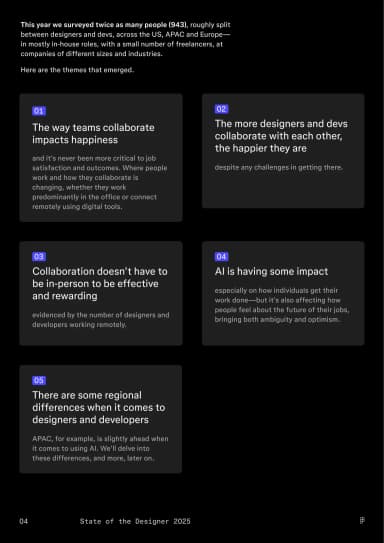
Compact summary cards turn survey findings into a modular, easy-to-scan overview.
Designer and developer trends · Figma · Page 4
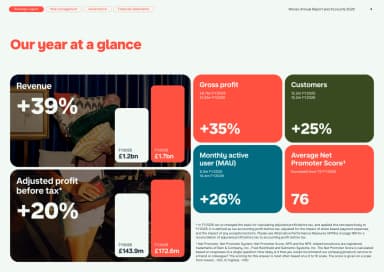
A modular grid gives key annual metrics separate coloured tiles with large figures and short labels.
Our year at a glance · Monzo · Page 4
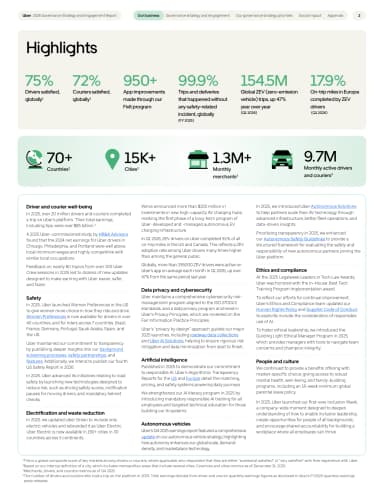
Green headline metrics and a pale icon strip sit above three narrow text columns on a complete portrait page.
Highlights · Uber · Page 4
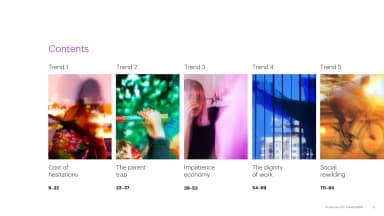
A numbered contents system groups the five themes into a scan-friendly roadmap.
Five trends · Accenture Song · Page 5
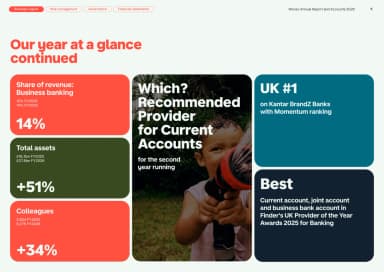
A second metrics page extends the same tile system with generous spacing and clear comparisons.
Our year at a glance continued · Monzo · Page 5
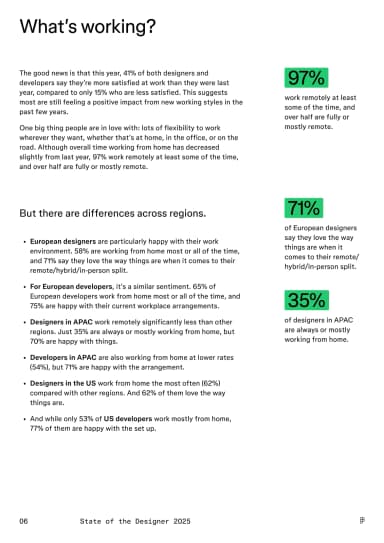
Survey figures and explanatory columns show what is improving workplace satisfaction.
What’s working? · Figma · Page 6
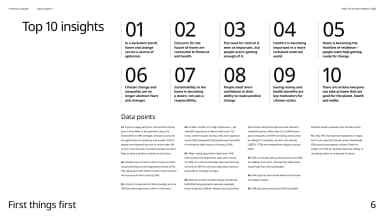
A structured index condenses ten findings into short statements with generous spacing and light visual hierarchy.
Top 10 insights · IKEA / Ingka Group · Page 6
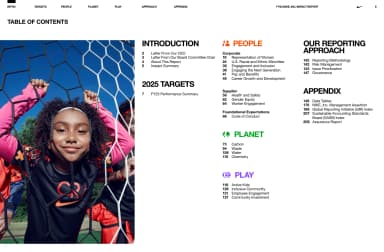
A structured contents page groups people, planet, play and reporting-approach sections.
Table of contents · Nike · Page 6
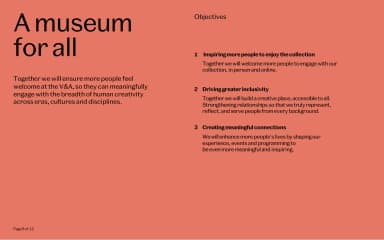
A coral page pairs a large strategic statement with three numbered objectives in a second column.
A museum for all · V&A · Page 8