Menu

Slides

Find a page by what it says or how it’s put together.
Filter (1)

54 slides

Slide results

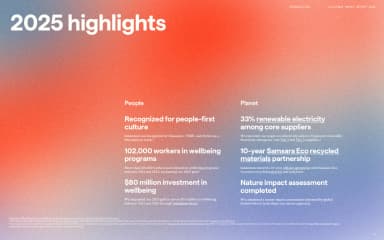
Two groups of white highlights sit low on an atmospheric red and blue artwork field beneath a large heading.
2025 highlights · lululemon · Page 5
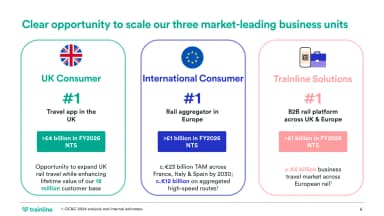
Three numbered business-unit columns align market positions and addressable opportunities with coloured headers.
Opportunity to scale · Trainline · Page 6
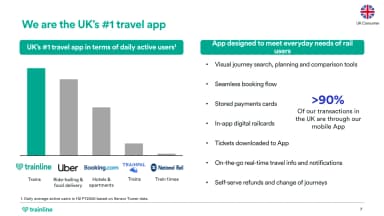
A simple grey-and-teal bar chart sits beside app capabilities and a large mobile-transaction percentage.
The UK's number-one travel app · Trainline · Page 8
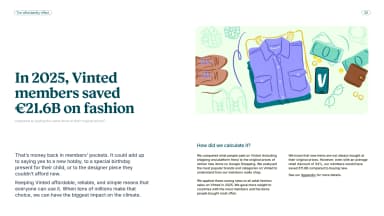
Vinted’s reported member savings on fashion appear beside pastel clothing illustrations, with calculation notes below.
Savings on fashion · Vinted · Page 7
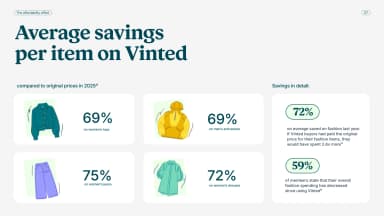
Four pastel product tiles compare percentage savings for different garments beside a vertical summary panel.
Average savings per item · Vinted · Page 8
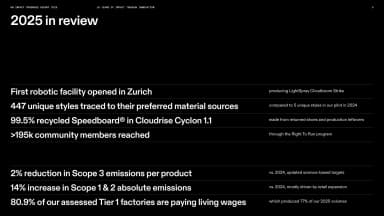
White figures and concise statements form an aligned review table across a black landscape page, with fine horizontal separators.
2025 in review · On · Page 5
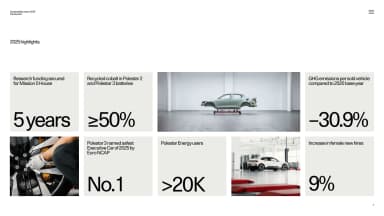
A modular grid mixes large black metrics on pale tiles with product and workshop photographs, surrounded by white space.
2025 highlights · Polestar · Page 7
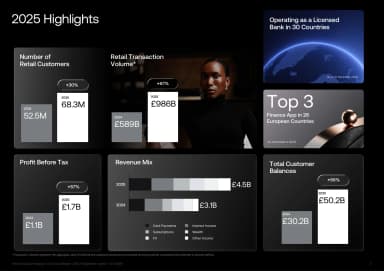
A dark modular dashboard combines bars, product photography and figures for customers, balances and revenue.
2025 retail highlights · Revolut · Page 4
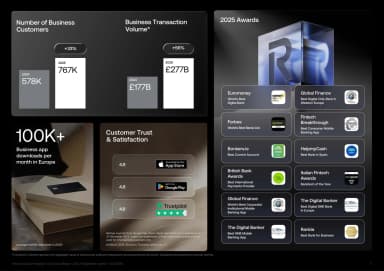
Aligned panels group business-customer metrics, transaction figures, ratings and awards against black.
2025 business highlights · Revolut · Page 5
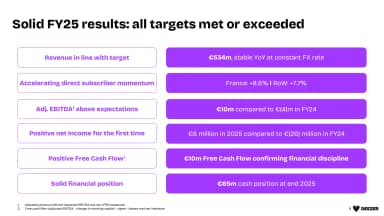
A two-column results table aligns financial priorities with purple metric bars and short supporting figures.
Solid FY25 results · Deezer · Page 4
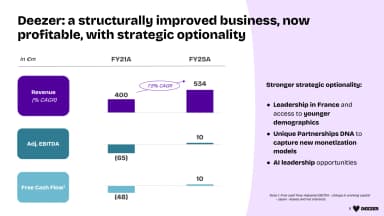
Three compact financial charts compare revenue, EBITDA and cash flow beside a lavender strategy panel.
A structurally improved business · Deezer · Page 5
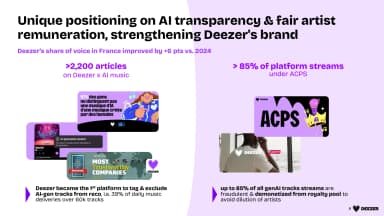
Two evidence columns pair purple statistics with press clippings and an artist-remuneration graphic.
AI transparency and artist remuneration · Deezer · Page 8
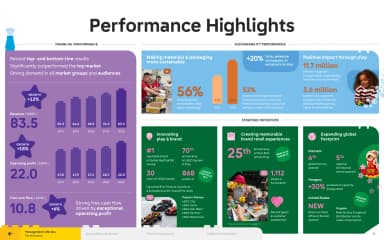
Large growth figures and simple charts make the year's performance immediately legible.
Performance highlights · The LEGO Group · Page 5
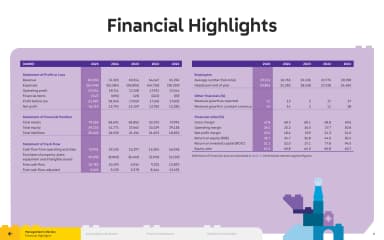
A purple financial table aligns annual numbers in a crisp, colour-coded grid.
Financial highlights · The LEGO Group · Page 6
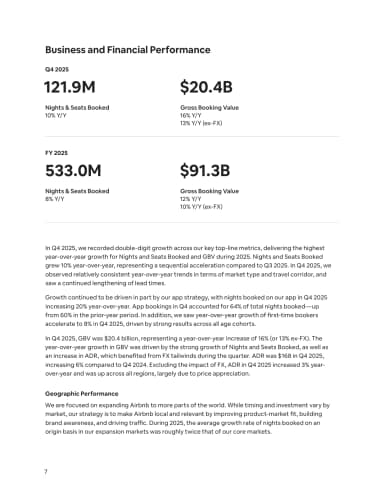
Two pairs of large financial figures, divided by thin rules, introduce a portrait page of business and geographic commentary.
Business and Financial Performance · Airbnb · Page 7
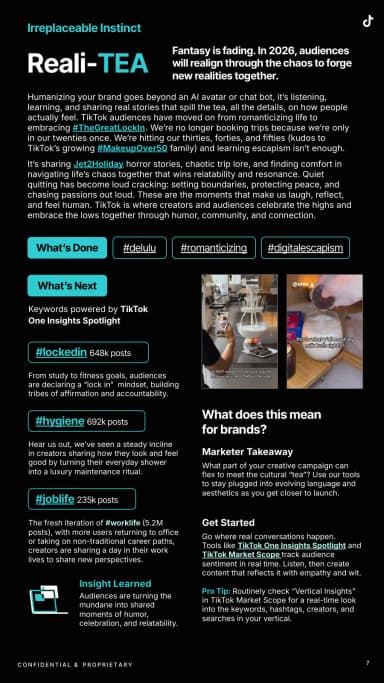
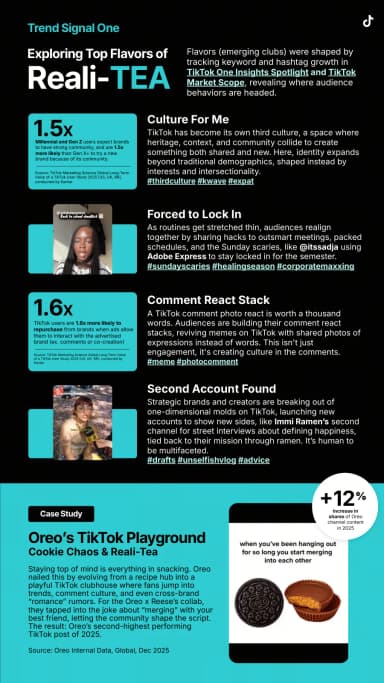
Headings, hashtag capsules, creator examples and cyan highlights organise trend evidence in narrow columns.
Reali-TEA signals · TikTok · Page 7
Three cyan statistic blocks and creator examples explain Reali-TEA signals above an Oreo campaign case study at the foot of the page.
Exploring Reali-TEA · TikTok · Page 8
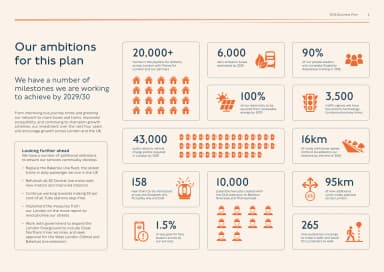
Orange pictograms and large figures form a dashboard of TfL’s planned milestones, with longer-term ambitions in a text column at the left.
Our ambitions for this plan · Transport for London · Page 6
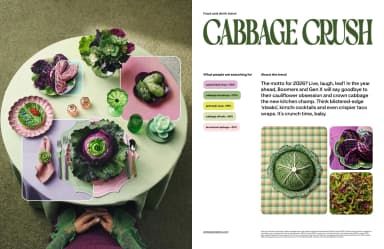
A cabbage-themed food still life is paired with green display type and compact search-growth figures.
Cabbage Crush · Pinterest · Page 6
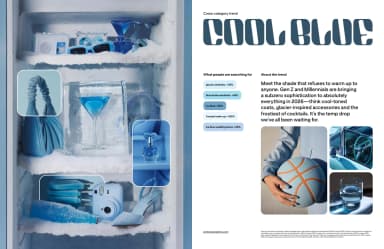
Blue product and beauty photographs create a colour-led collage beside a large trend title and audience signals.
Cool Blue · Pinterest · Page 7
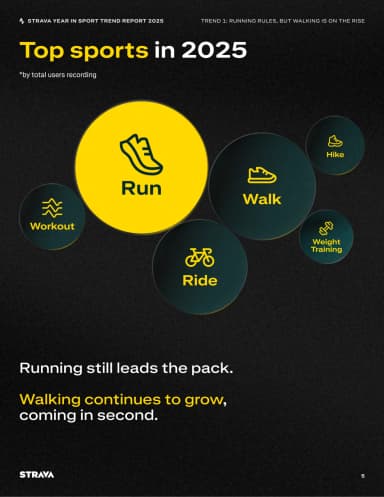
Differently sized labelled circles and simple activity icons compare the most recorded sports.
Top sports in 2025 · Strava · Page 5
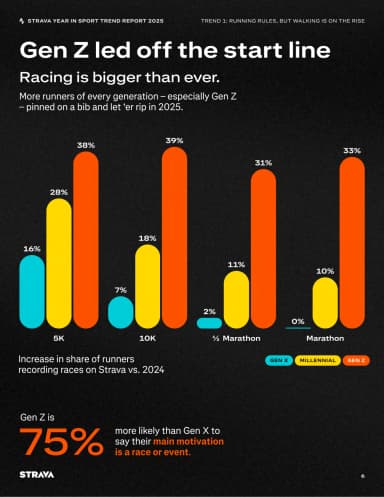
Rounded coloured bars compare race participation by generation, followed by a large motivation statistic.
Gen Z led off the start line · Strava · Page 6
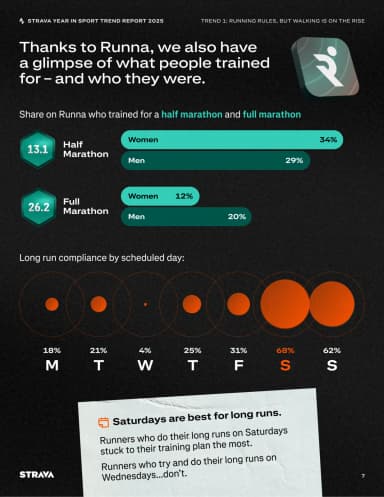
Two horizontal bar comparisons and a row of scaled circles explain training patterns and long-run days.
Training with Runna · Strava · Page 7
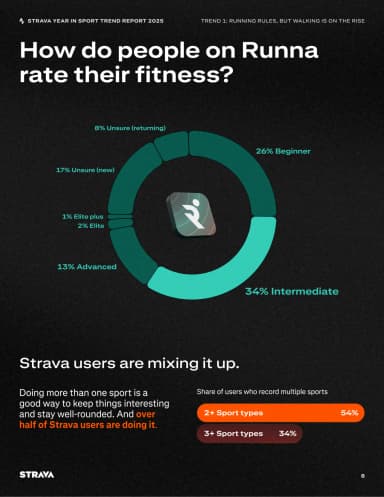
A segmented teal ring around the Runna mark compares reported fitness levels, followed by a separate bar comparison of people recording multiple sports.
Fitness levels and multiple sports · Strava · Page 8
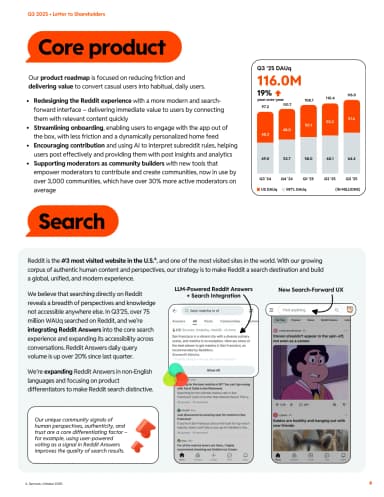
Orange label shapes organise product narrative, a user-growth chart and mobile search interface examples.
Core product and search · Reddit · Page 6
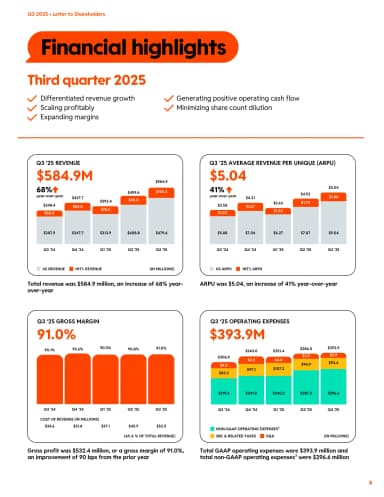
Four chart panels compare Reddit’s revenue, revenue per user, gross margin and operating expenses using orange, yellow and blue accents.
Financial highlights · Reddit · Page 8
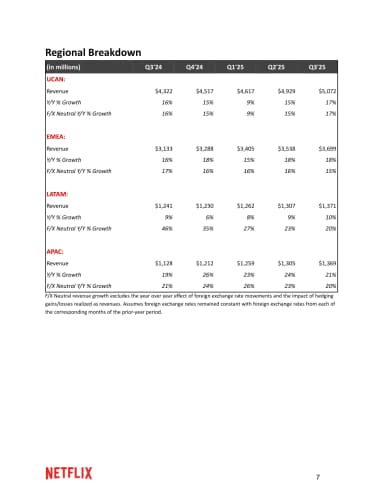
A compact table compares regional revenue and growth across quarters with red group labels.
Regional breakdown · Netflix · Page 7
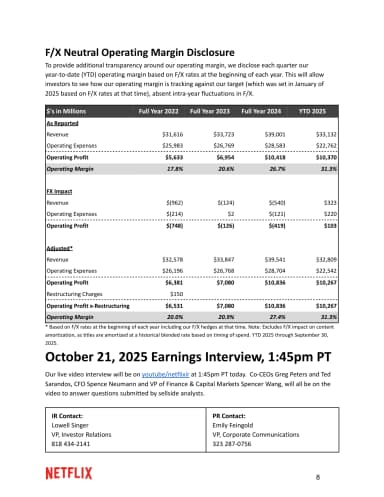
A grey table compares foreign-exchange-neutral operating margins above earnings-interview details and two investor contact blocks.
FX-neutral operating margin disclosure · Netflix · Page 8
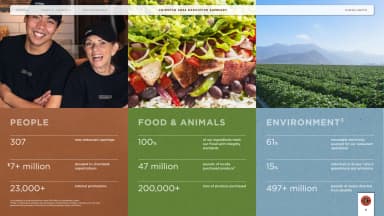
Three colour-coded columns group Chipotle’s People, Food & Animals, and Environment highlights beneath staff, food and farm photographs.
People, food and animals, and environment · Chipotle · Page 5
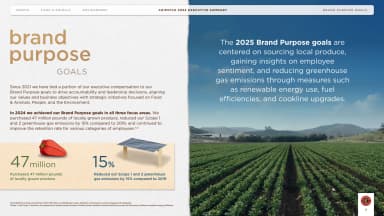
A two-part layout contrasts purpose targets and small ingredient illustrations with a large agricultural photograph.
Brand purpose goals · Chipotle · Page 7
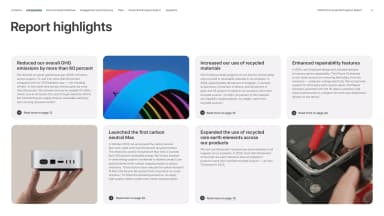
Five pale highlight cards about emissions, materials, a Mac and repairability alternate with three photographs in a two-row grid.
Report highlights · Apple · Page 4
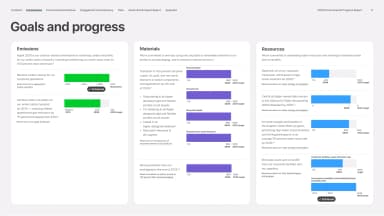
A three-column dashboard aligns Apple’s carbon, resource and chemistry goals with green, purple and blue progress bars and explanatory labels.
Goals and progress · Apple · Page 5
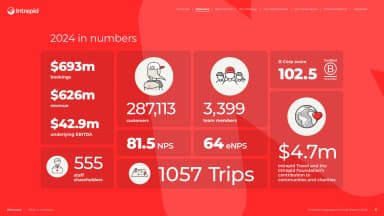
Large white figures and small line illustrations form a red annual-performance dashboard.
2024 in numbers · Intrepid Travel · Page 5
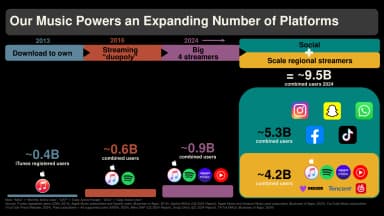
Coloured bands connect stages of music distribution to platform logos and audience figures against a black background.
An expanding number of platforms · Universal Music Group · Page 12
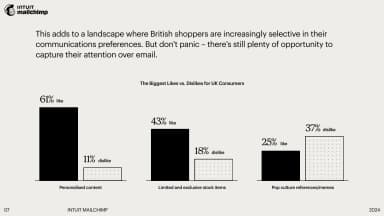
A restrained grouped bar chart compares personalised content, limited stock and pop-culture references in black and dotted bars.
Consumer likes and dislikes · Intuit Mailchimp · Page 7
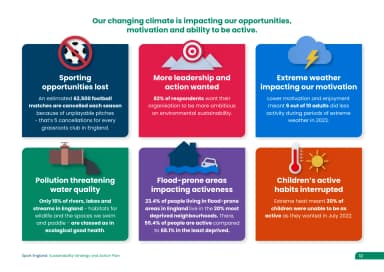
Six colourful illustrated cards explain disruption from extreme weather, pollution and changing environments.
Climate impacts on sport · Sport England · Page 12
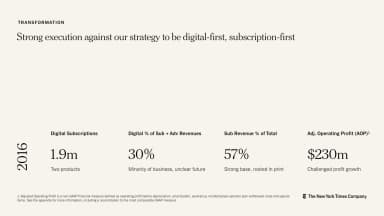
A light transformation page aligns four business metrics along a shared baseline for 2016.
Digital-first, subscription-first · The New York Times Company · Page 9
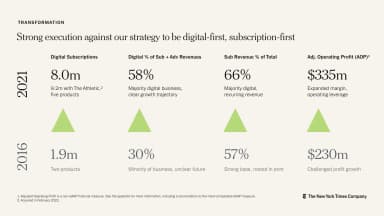
A matching metrics page compares 2016 and 2021 figures, using green triangles to emphasise growth.
Transformation in 2021 · The New York Times Company · Page 10
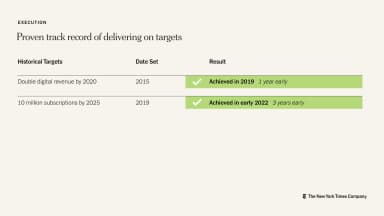
A three-column table records historic targets, the year set and results highlighted in green.
Delivering on targets · The New York Times Company · Page 11
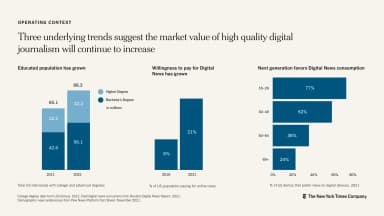
Three blue bar charts compare the addressable market, digital news payment and generational reach.
Market opportunity · The New York Times Company · Page 12
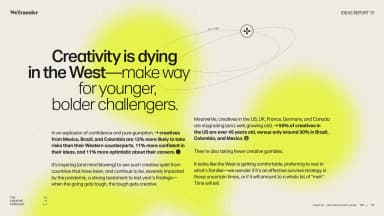
An editorial research page combines a large headline, three text columns and a small highlighted list.
Creativity is dying in the West · WeTransfer · Page 10
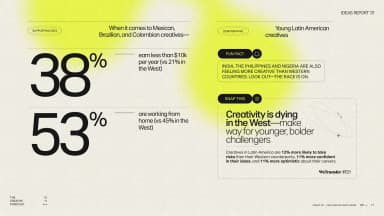
Two oversized percentages anchor a research page, balanced against country annotations and a narrow list.
Creative careers across markets · WeTransfer · Page 11
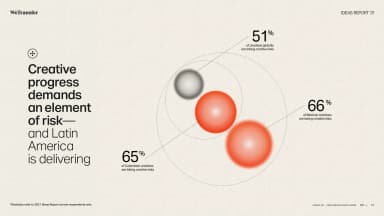
A large stacked sentence sits beside a cluster of three orange spheres labelled with survey percentages.
Creative progress demands risk · WeTransfer · Page 12
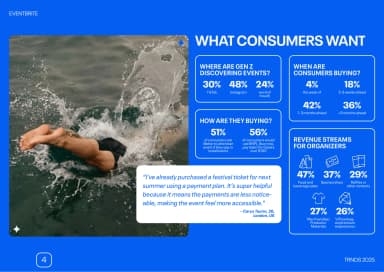
White panels of event-discovery and ticket-buying statistics sit beside an open-water swimming photograph on a saturated-blue background.
What consumers want · Eventbrite · Page 4
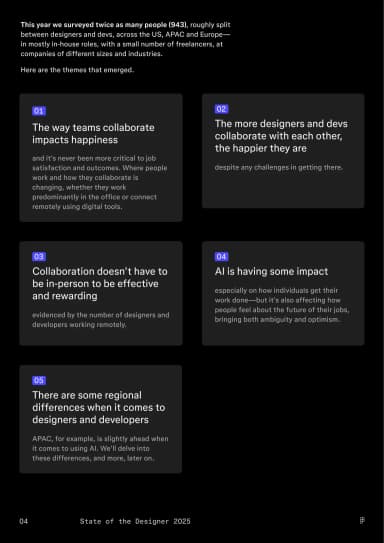
Compact summary cards turn survey findings into a modular, easy-to-scan overview.
Designer and developer trends · Figma · Page 4
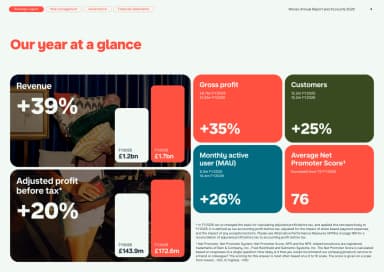
A modular grid gives key annual metrics separate coloured tiles with large figures and short labels.
Our year at a glance · Monzo · Page 4
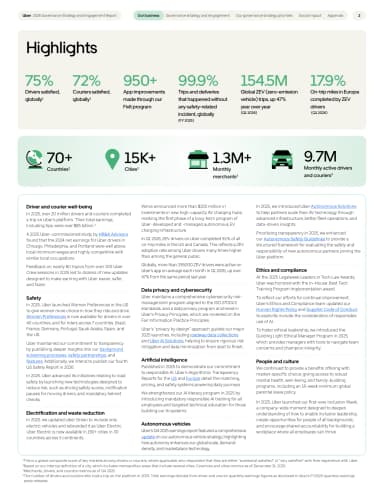
Green headline metrics and a pale icon strip sit above three narrow text columns on a complete portrait page.
Highlights · Uber · Page 4
A second metrics page extends the same tile system with generous spacing and clear comparisons.
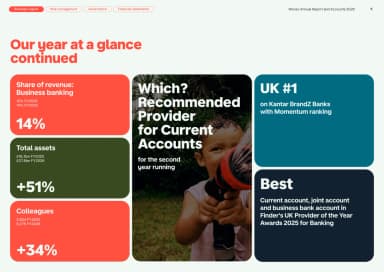
Our year at a glance continued · Monzo · Page 5
Large performance figures and short labels sit against sport imagery to make the impact summary scannable.
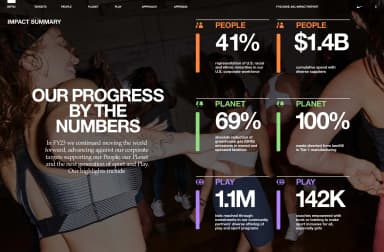
Progress against targets · Nike · Page 5
A world map and large figures explain currency coverage, country reach and customer scale.
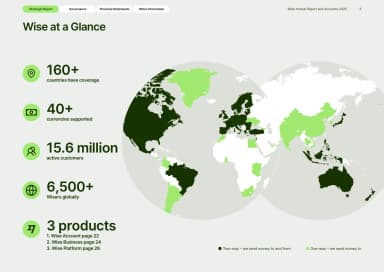
Wise at a glance · Wise · Page 5
Survey figures and explanatory columns show what is improving workplace satisfaction.
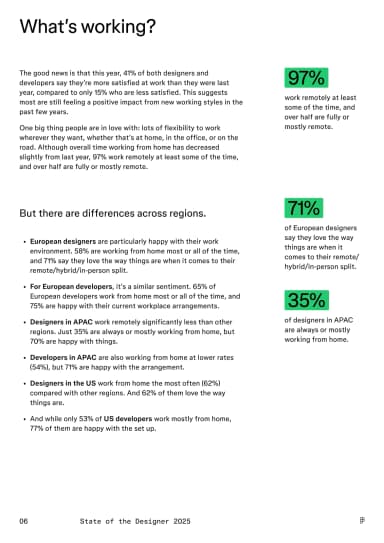
What’s working? · Figma · Page 6
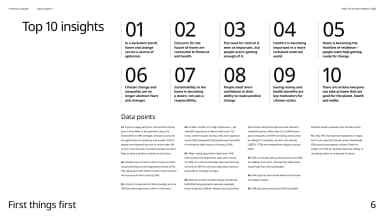
A structured index condenses ten findings into short statements with generous spacing and light visual hierarchy.
Top 10 insights · IKEA / Ingka Group · Page 6
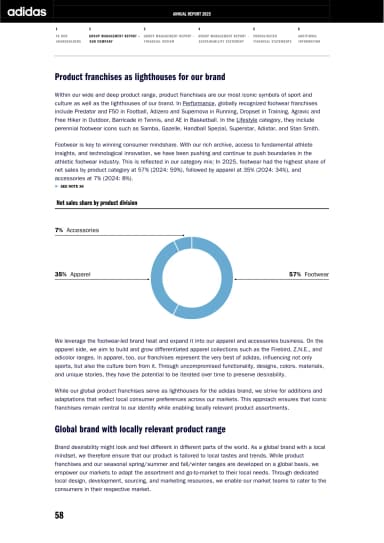
A blue doughnut chart shows the product mix between explanatory sections about franchises and local relevance.
Product franchises · adidas · Page 7
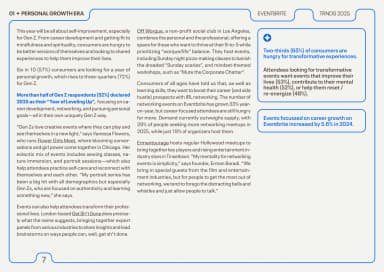
Two editorial columns sit beside a blue-outlined insight panel, with key survey findings highlighted in blue.
Personal growth insights · Eventbrite · Page 7